The Week in Review: November 21, 2022
A Big Pile of Cash on the Sidelines
Recession fears are rampant. Interest rates are up, which discourages spending, and housing, a leading economic indicator, has fallen into a steep recession.
As reported on Friday, the Conference Board’s Leading Economic Index (LEI), which is designed to detect trends in advance, is down 8-straight months, including a sharp 0.8% decline in October.
Let’s back up for a moment. Congress’s response to the pandemic was to flood the economy with cash, including generous jobless benefits, tax credits, and stimulus checks. The extra cash boosted spending, but not all has been spent.
The Federal Reserve estimates that households still hold $1.7 trillion in government largesse, down from a peak of $2.3 trillion. It is excess savings over and above what households might otherwise have held if pre-pandemic trends had continued.

Why is this significant? According to the U.S. Bureau of Economic Analysis, consumer spending accounts for 70% of the total economy.
Excess cash in the bank is aiding consumer spending, helping to bridge the gap of wage hikes that haven’t kept up with inflation.
A $1.7 trillion war chest is significant and could help mitigate some headwinds from Fed rate hikes and higher inflation.
But it could also complicate the Fed’s job, as it hopes to combat high inflation by slowing down the economy, bringing demand back in line with supply.
The Conference Board believes “a recession is likely to start around year-end and last through mid-2023.” However, economic forecasts are dicey, and the LEI does not make allowances for the mountain of cash that sits in savings.
Finally, as we approach Thanksgiving, I want to wish you and your loved ones a joyous and happy holiday!
If you have any questions or concerns, please do not hesitate to contact me directly.
Two for the Road
Since 1950, the average return for the S&P 500 in the 12 months after a midterm election is 15%, surprisingly with no down years. Stocks performed better in the six months following the election than in the six months preceding it 17 out of 19 times. And a split government has historically produced a roughly 13% annual return.
The latest World Container Index – a key benchmark for container prices – has fallen again to $2,773 per 40-foot container. That’s 73% lower than the peak rate in September of last year. - CNBC, November 10, 2022
This commentary reflects the personal opinions, viewpoints and analyses of the Stordahl Capital Management, Inc. employees providing such comments, and should not be regarded as a description of advisory services provided by Stordahl Capital Management, Inc. or performance returns of any Stordahl Capital Management, Inc. Investments client. The views reflected in the commentary are subject to change at any time without notice. Nothing in this piece constitutes investment advice, performance data or any recommendation that any particular security, portfolio of securities, transaction or investment strategy is suitable for any specific person. Any mention of a particular security and related performance data is not a recommendation to buy or sell that security. Accessing websites through links directs you away from our website. Stordahl Capital Management is not responsible for errors or omissions in the material on third party websites and does not necessarily approve of or endorse the information provided. Users who gain access to third party websites may be subject to the copyright and other restrictions on use imposed by those providers and assume responsibility and risk from the use of those websites. Please note that trading instructions through email, fax or voicemail will not be taken. Your identity and timely retrieval of instructions cannot be guaranteed. Stordahl Capital Management, Inc. manages its clients’ accounts using a variety of investment techniques and strategies, which are not necessarily discussed in the commentary. Investments in securities involve the risk of loss. Past performance is no guarantee of future results.
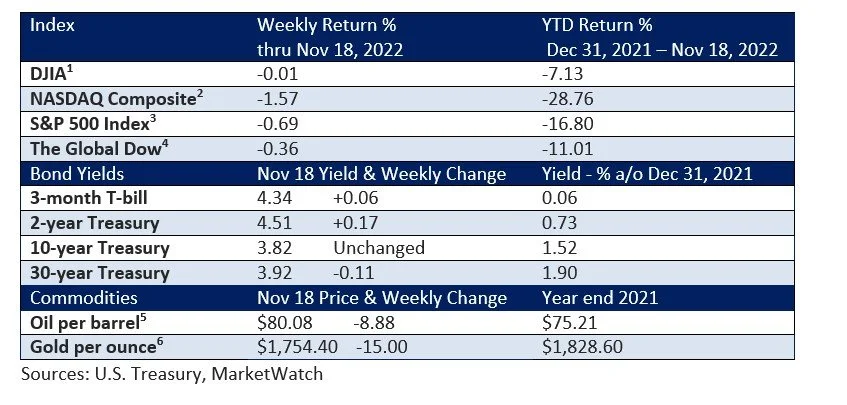
1. The Dow Jones Industrials Average is an unmanaged index of 30 major companies which cannot be invested into directly. Past performance does not guarantee future results.
2. The NASDAQ Composite is an unmanaged index of companies which cannot be invested into directly. Past performance does not guarantee future results.
3. The S&P 500 Index is an unmanaged index of 500 larger companies which cannot be invested into directly. Past performance does not guarantee future results.
4. The Global Dow is an unmanaged index composed of stocks of 150 top companies. It cannot be invested into directly. Past performance does not guarantee future results.
5. CME Group front-month contract; Prices can and do vary; past performance does not guarantee future results.
6. CME Group continuous contract; Prices can and do vary; past performance does not guarantee future results.