The Week in Review: October 17, 2022
Stubbornly High Inflation
The release of the September Consumer Price Index (CPI) offered more sobering news, as inflation continues to run hot. The U.S. Bureau of Labor Statistics (BLS) reported the CPI for September rose 0.4% versus August. The core CPI, which excludes food and energy, rose 0.6%.
Economists had forecast a 0.3% and 0.4% increase, respectively, according to DJ Newswires.
Food and energy are important components of the cost of living. Recently, gasoline prices have fallen, but CPI data continue to reflect sharp gains for food.

If we strip out food and energy, the core rate of inflation has been steady over the last 12 months—no signs of a peak, just a long plateau.
The Fed is letting bonds bought in the pandemic run off its balance sheet, while the disappointing CPI almost guarantees another 75-basis point (bp, 1 bp = 0.01%) rate hike at the Fed’s November 2 meeting, unless the sharp rate hikes spark unwanted financial instability.
We haven’t seen that at home, but the U.K. has recently experienced financial turbulence.
Low U.K. government bond yields during the 2010s encouraged U.K. pension funds to adopt more aggressive strategies to boost returns.
But as yields have risen this year and bond prices have fallen (bonds and yields move in the opposite direction), the value of these complex strategies fell, forcing pension funds to sell government bonds to raise cash.
Forced selling pushed bond prices even lower, forcing additional sales—a so-called doom loop—until the Bank of England intervened to buy government bonds.
It’s hard to know what might be lurking under the surface, but it’s unlikely we are in immediate danger of something “breaking” in the U.S., which could force a U-turn in Fed policy.
Fed officials have signaled they will eventually slow the pace of increases and assess the effects of current policy on the economy and inflation. For now, the Fed continues to take a hard line on inflation, as it plays catch-up after failing to raise rates last year.
If you have any questions or concerns, please do not hesitate to contact me directly.
Two for the Road
The average length of a bear market is 289 days or about 9.6 months. That’s significantly shorter than the average length of a bull market, which is 991 days or 2.7 years. - Hartford Funds
We’ve seen a significant drawdown in the US Strategic Petroleum Reserve, which has moved down to its lowest level since 1984. - Forbes, September 7, 2022
This commentary reflects the personal opinions, viewpoints and analyses of the Stordahl Capital Management, Inc. employees providing such comments, and should not be regarded as a description of advisory services provided by Stordahl Capital Management, Inc. or performance returns of any Stordahl Capital Management, Inc. Investments client. The views reflected in the commentary are subject to change at any time without notice. Nothing in this piece constitutes investment advice, performance data or any recommendation that any particular security, portfolio of securities, transaction or investment strategy is suitable for any specific person. Any mention of a particular security and related performance data is not a recommendation to buy or sell that security. Accessing websites through links directs you away from our website. Stordahl Capital Management is not responsible for errors or omissions in the material on third party websites and does not necessarily approve of or endorse the information provided. Users who gain access to third party websites may be subject to the copyright and other restrictions on use imposed by those providers and assume responsibility and risk from the use of those websites. Please note that trading instructions through email, fax or voicemail will not be taken. Your identity and timely retrieval of instructions cannot be guaranteed. Stordahl Capital Management, Inc. manages its clients’ accounts using a variety of investment techniques and strategies, which are not necessarily discussed in the commentary. Investments in securities involve the risk of loss. Past performance is no guarantee of future results.
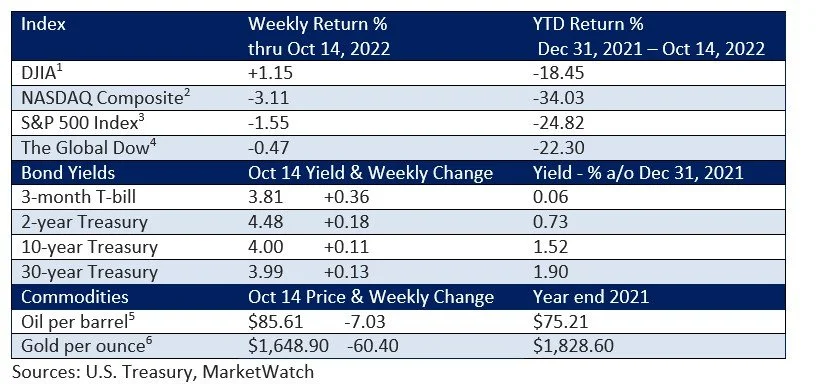
1. The Dow Jones Industrials Average is an unmanaged index of 30 major companies which cannot be invested into directly. Past performance does not guarantee future results.
2. The NASDAQ Composite is an unmanaged index of companies which cannot be invested into directly. Past performance does not guarantee future results.
3. The S&P 500 Index is an unmanaged index of 500 larger companies which cannot be invested into directly. Past performance does not guarantee future results.
4. The Global Dow is an unmanaged index composed of stocks of 150 top companies. It cannot be invested into directly. Past performance does not guarantee future results.
5. CME Group front-month contract; Prices can and do vary; past performance does not guarantee future results.
6. CME Group continuous contract; Prices can and do vary; past performance does not guarantee future results.